Real-Time Web Analytics Dashboard & Performance Monitoring
Comprehensive real-time analytics dashboard providing instant insights into your website's traffic, performance metrics, user behavior patterns, and error monitoring through interactive visualizations and data-driven analytics.
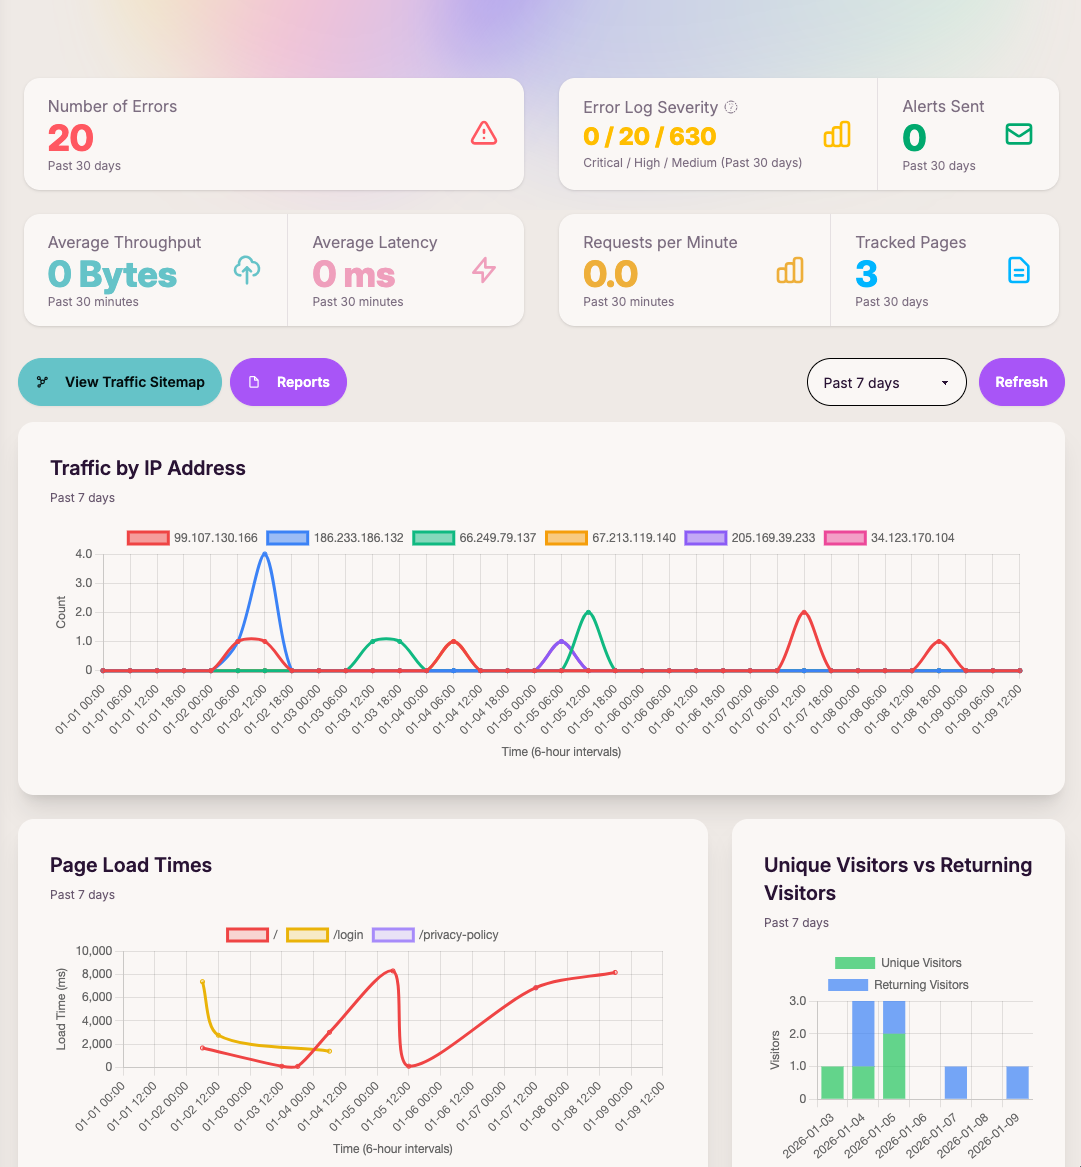
Key Metrics
- Page Load Times: Recent page load times by URL path
- Traffic Analytics: Page views and transfer size by day
- User Interactions: On-click and rage-click activity tracking
- IP Analysis: High-volume IP offenders and top visitors
- Visitor Analytics: Unique vs returning visitors comparison
- Event Distribution: Event tracking donut charts and breakdowns
How It Works
The Dashboard provides a centralized view of all your tracking data with interactive charts and visualizations. Metrics update in real-time as data flows in, giving you immediate insights into your website's performance and user behavior.
Visualizations
- Line Charts: Track trends over time for page views, transfer size, and performance
- Bar Charts: Compare metrics across different URL paths or time periods
- Donut Charts: Visualize event type distributions
- Tables: Detailed breakdowns of top performers and offenders
Use Cases
- Monitor website performance in real-time
- Identify traffic patterns and trends
- Detect unusual activity or potential issues
- Compare performance across different time periods
- Understand user behavior and engagement